Definition
A partial motion in motion with uniform acceleration has different velocities at different instants of time. These velocities can be found out by using the relation v = u + at. The graph plotted with time on x axis and velocities on y axis is called a velocity time graph.
In case of motion with uniform acceleration this graph consists of straight lines. This graph can be used to find unknowns like distance travelled, acceleration, time and velocity.
- Area of V – T diagram gives the distance travelled.
- Slope of the V – T diagram gives the acceleration.
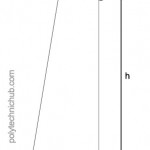
Diagram

Diagram shows v-t dia for motion of a body starting with initial velocity (u) and moving at a constant acceleration (a1), then moving with uniform velocity and then showing down to come at rest with uniform relation.